
Eagle Observe: Your All-in-One Research Command Center
Securely build, share, and analyze sophisticated surveys in one unified platform. Design fully branded experiences with custom start/end pages featuring images and rich content. Our intelligent Survey Quality Analyzer evaluates your question design to forecast data quality before you publish. Never lose data, streamline collaboration, and launch projects faster with advanced features like skip logic, anonymous follow-ups, and integrated analysis.
Enterprise-Grade Privacy. European Roots
We take a strict, no-compromise approach to your data security
Strategic Hosting
All servers are hosted within the EU (Sweden & Amsterdam), ensuring your data remains under the protection of European privacy laws.
Strict GDPR Compliance
We follow the General Data Protection Regulation strictly, giving you full control and transparency over your personal information.
Data Integrity
Your information is protected by advanced encryption and handled with absolute transparency.
The Survey Configuration Center: Your Command Hub for Survey Excellence
This is your survey’s control room. Within this streamlined interface, you have complete command over the entire survey lifecycle through four core pillars:
- Content Creation
- Respondent Management
- Survey Actions
- Data Visualization
- Manage Invitations
- Export Data
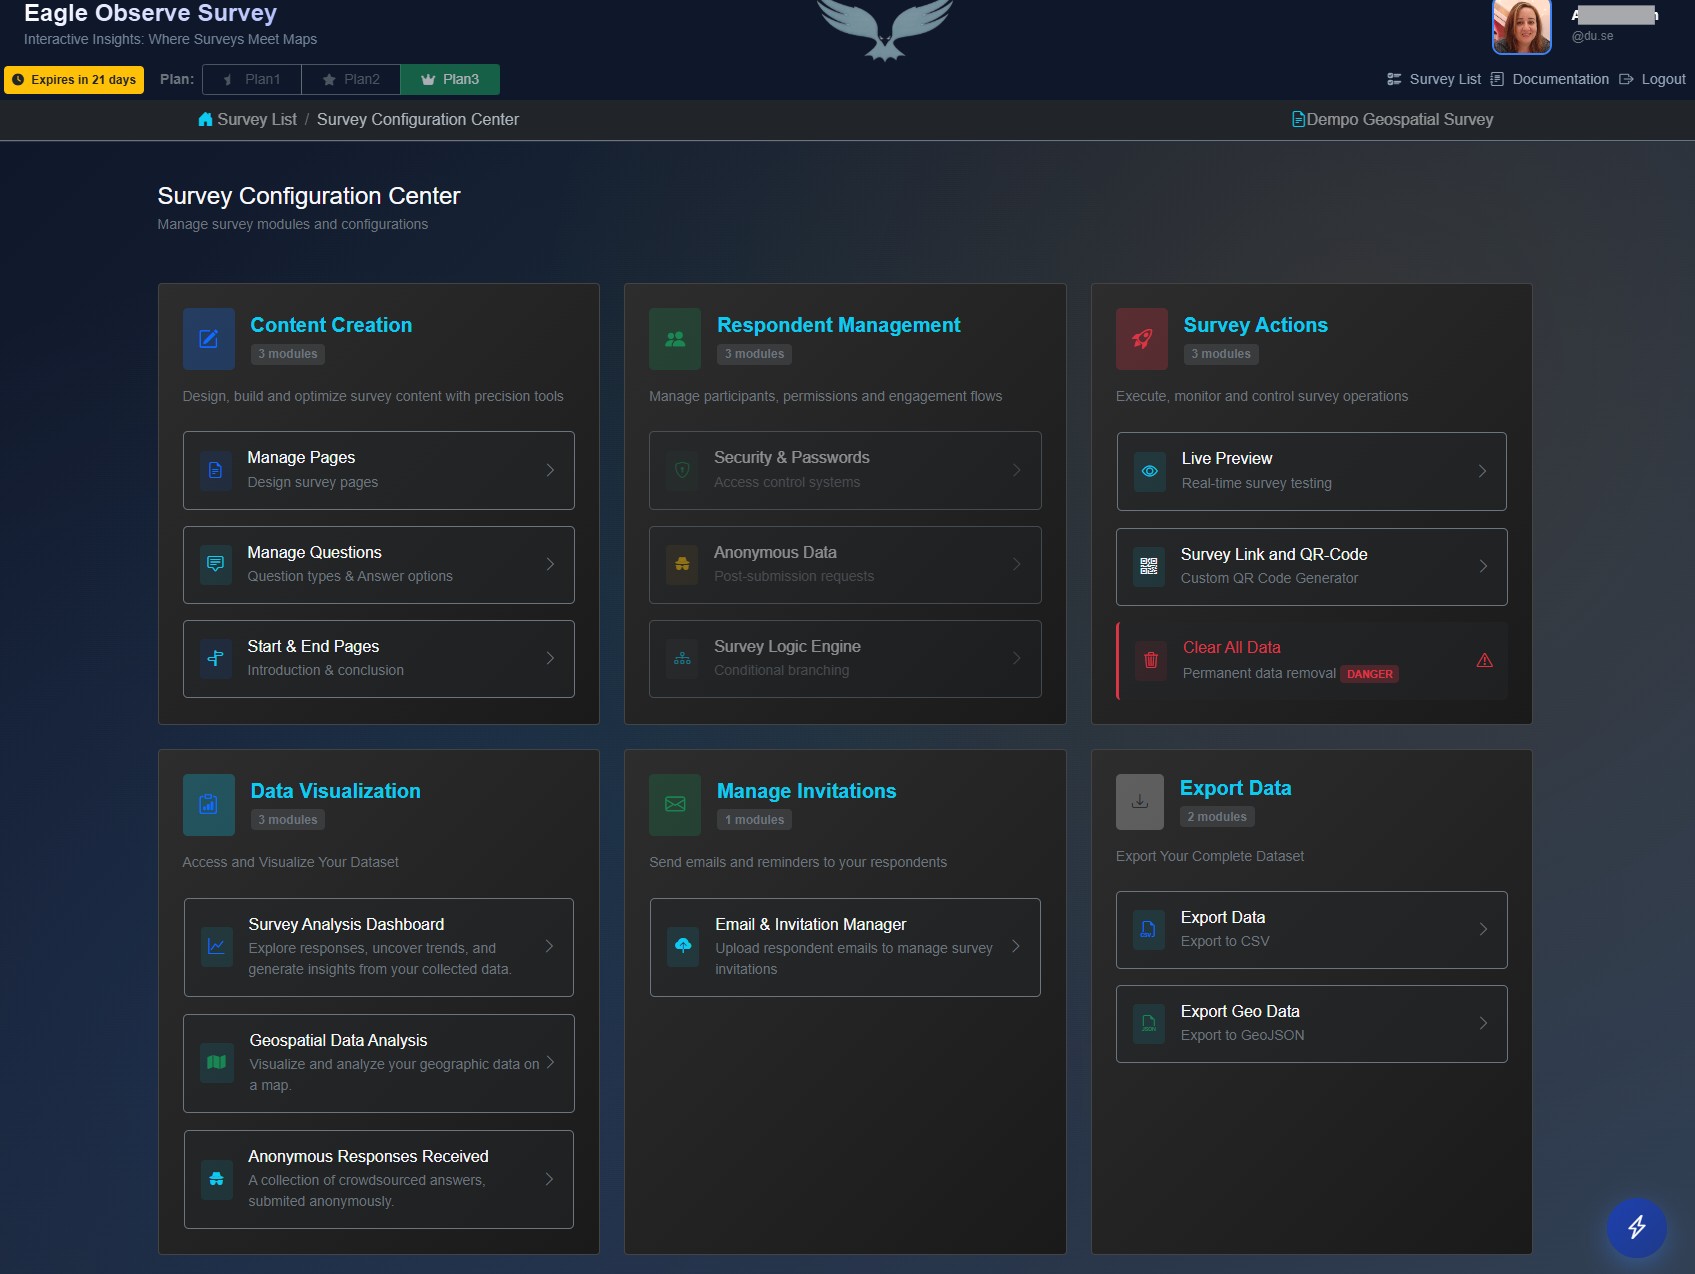
Content Creation
- Structure Your Survey: Create and organize the page flow.
- Build Your Questions: Write, customize, and order all question items.
- Set the Experience: Design the introductory and closing pages.
Respondent Management
- Add password protection to surveys.
- Configure surveys to display final anonymize question upon submission.
- Set up skip logic to control page flow.
Survey Actions
- Live preview: real time survey testing
- Custom QR code generator
- Clear testing data before publish
Data Visualization
- Survey analysis dashboard: explore responses, uncover trends, and generate insight from your collected data
- Geospatial Data Analysis: Analyze spatial patterns with Heatmap, Cluster, Nearest Neighbor, and Grid analysis tools
- View answers display from final anonymize question upon submission.
Manage Invitations
- Send Invitations
- Send Reminders
- Communication statistics
Export Data
- Export Data to CSV file
- Export Geo Question Data to GeoJSON file.
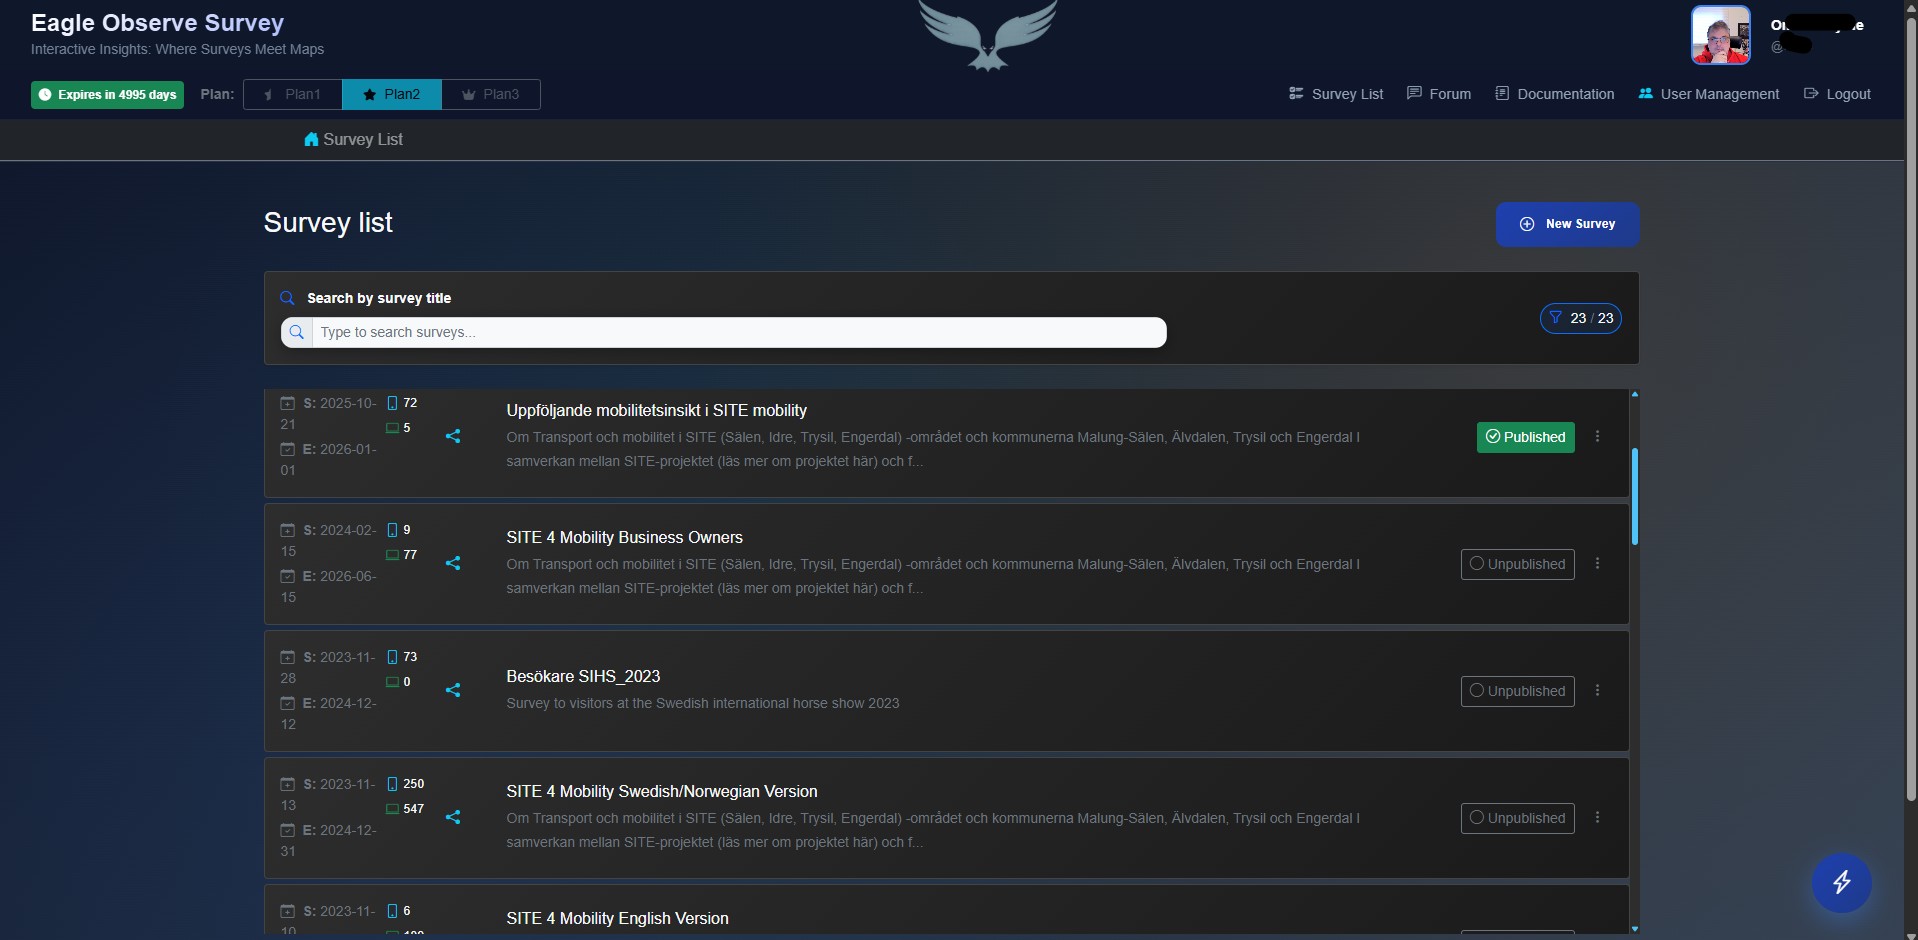
Your Secure Survey Hub. Organized, Collaborative, Efficient
Every user gets a private, secure workspace, a personal container for all their surveys. Duplicate any survey with one click to launch new projects instantly, eliminating repetitive setup. Your hub clearly organizes everything: surveys you’ve created, surveys shared with you by teammates, and those you’ve shared with others, keeping collaboration seamless and transparent.
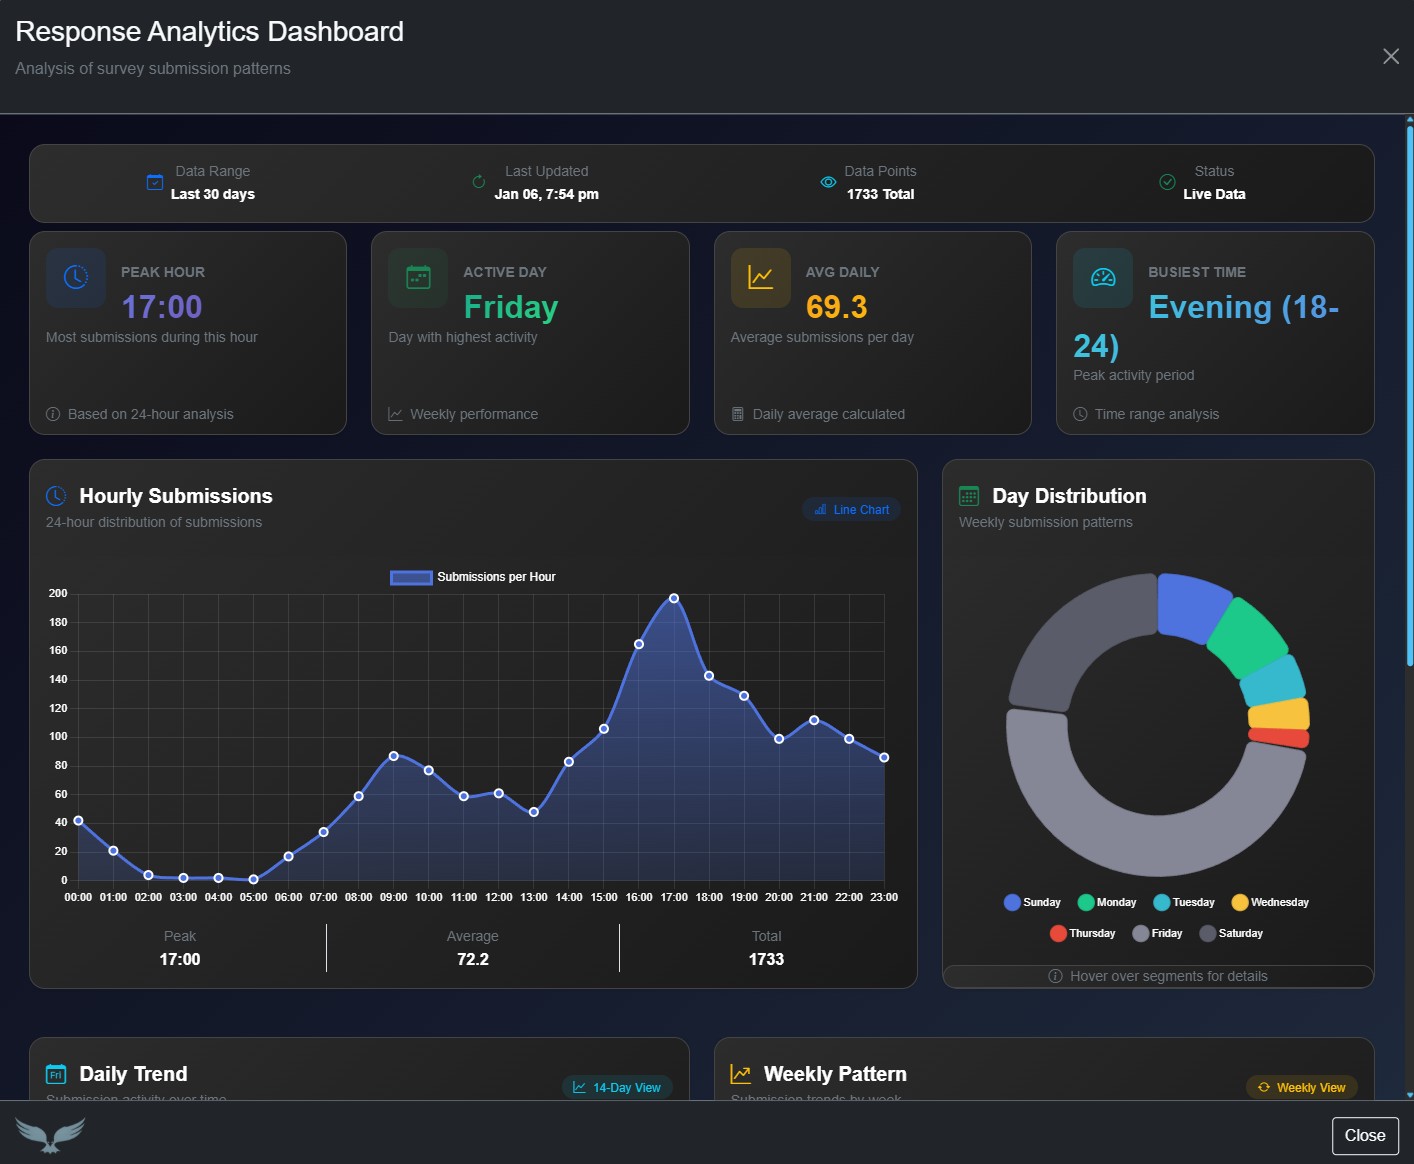
Response Analytics Dashboard
Turn raw data into actionable insights. Our detailed reporting suite gives you a complete, real-time view of your survey’s performance with metrics like:
- Date Range & Activity: Track submissions within any custom period, see the latest updates, and monitor total data points.
- Temporal Patterns: Identify peak submission hours, your most active days, and calculate average daily volume.
- Advanced Visual Analytics: Uncover trends with interactive charts, including an hourly submission trend line, a day-of-week distribution pie chart, daily and weekly pattern charts, and focused time-range analysis.
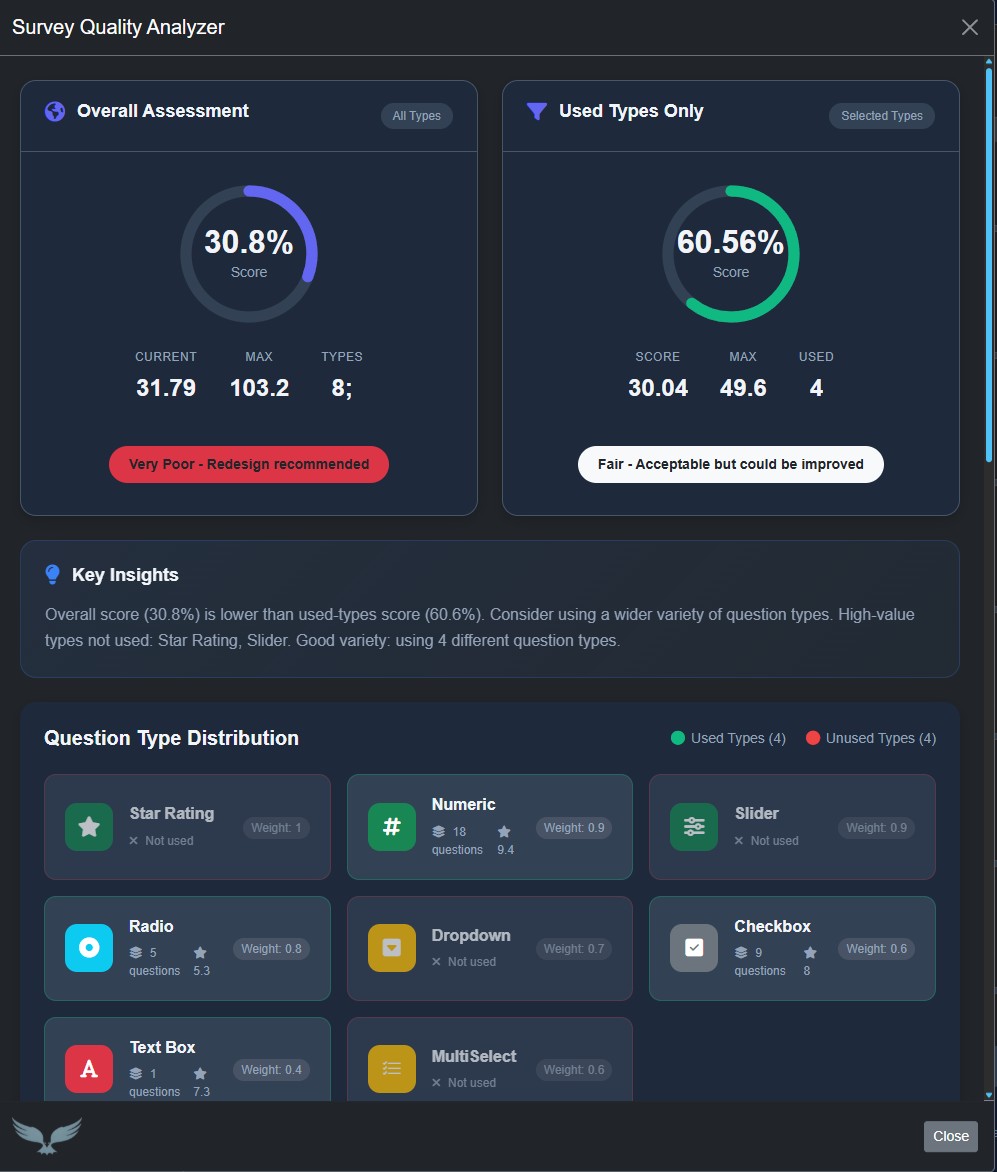
Survey Quality Analyzer: Build Better Surveys with Expert-Guided Insights
Elevate your data quality before you publish. Our intelligent analyzer, powered by proven research and methodological algorithms, evaluates your survey’s structure and provides a tailored quality score from two perspectives: a theoretical score based on all available best-practice options, and a practical score based on the tools you’ve actually used. You’ll receive specific, actionable recommendations to strengthen questions, optimize answer choices, and improve overall design, backed by a visual breakdown of your answer-type distribution.
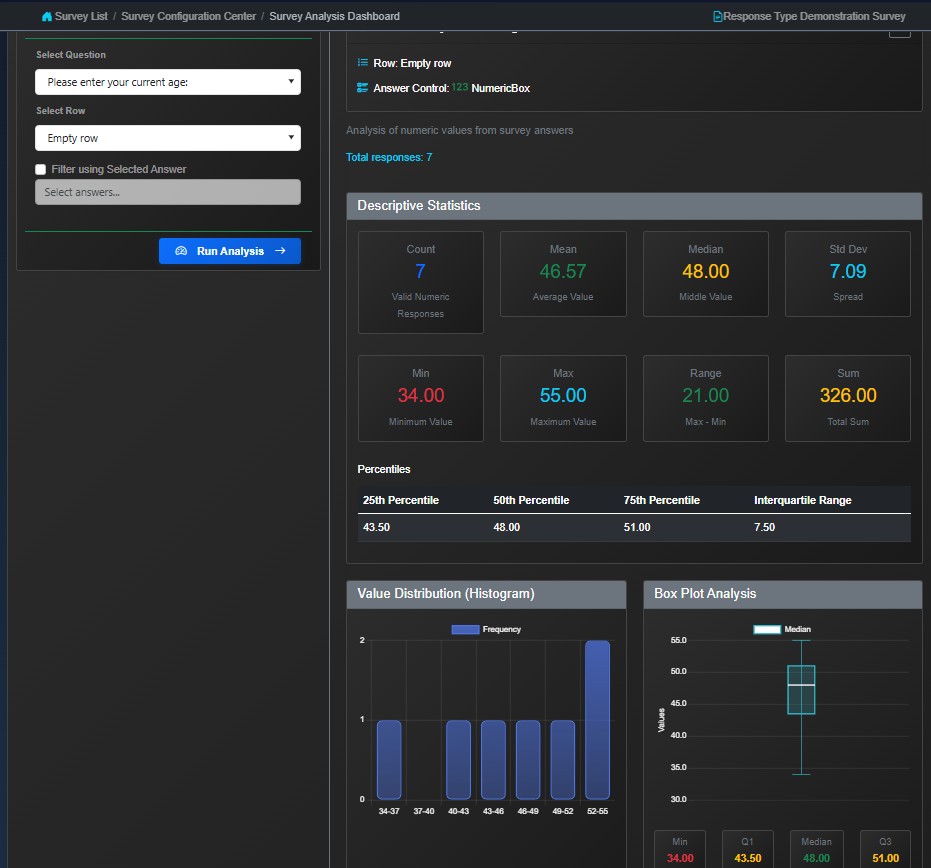
Survey Analysis Dashboard
Welcome to your command center for decision-ready feedback. This Survey Analysis Dashboard transforms complex responses into crystal-clear intelligence, providing sophisticated analysis across every data format:
- Qualitative Narratives (Text Data)
- Quantitative Metrics (Numeric Data)
- Definitive Choices (Single Select)
- Multi-Dimensional Feedback (Multi-Select)
Experience your data through dynamic visual dashboards, interactive charts, and granular data tables, all designed to reveal not just what was said, but what it truly means.
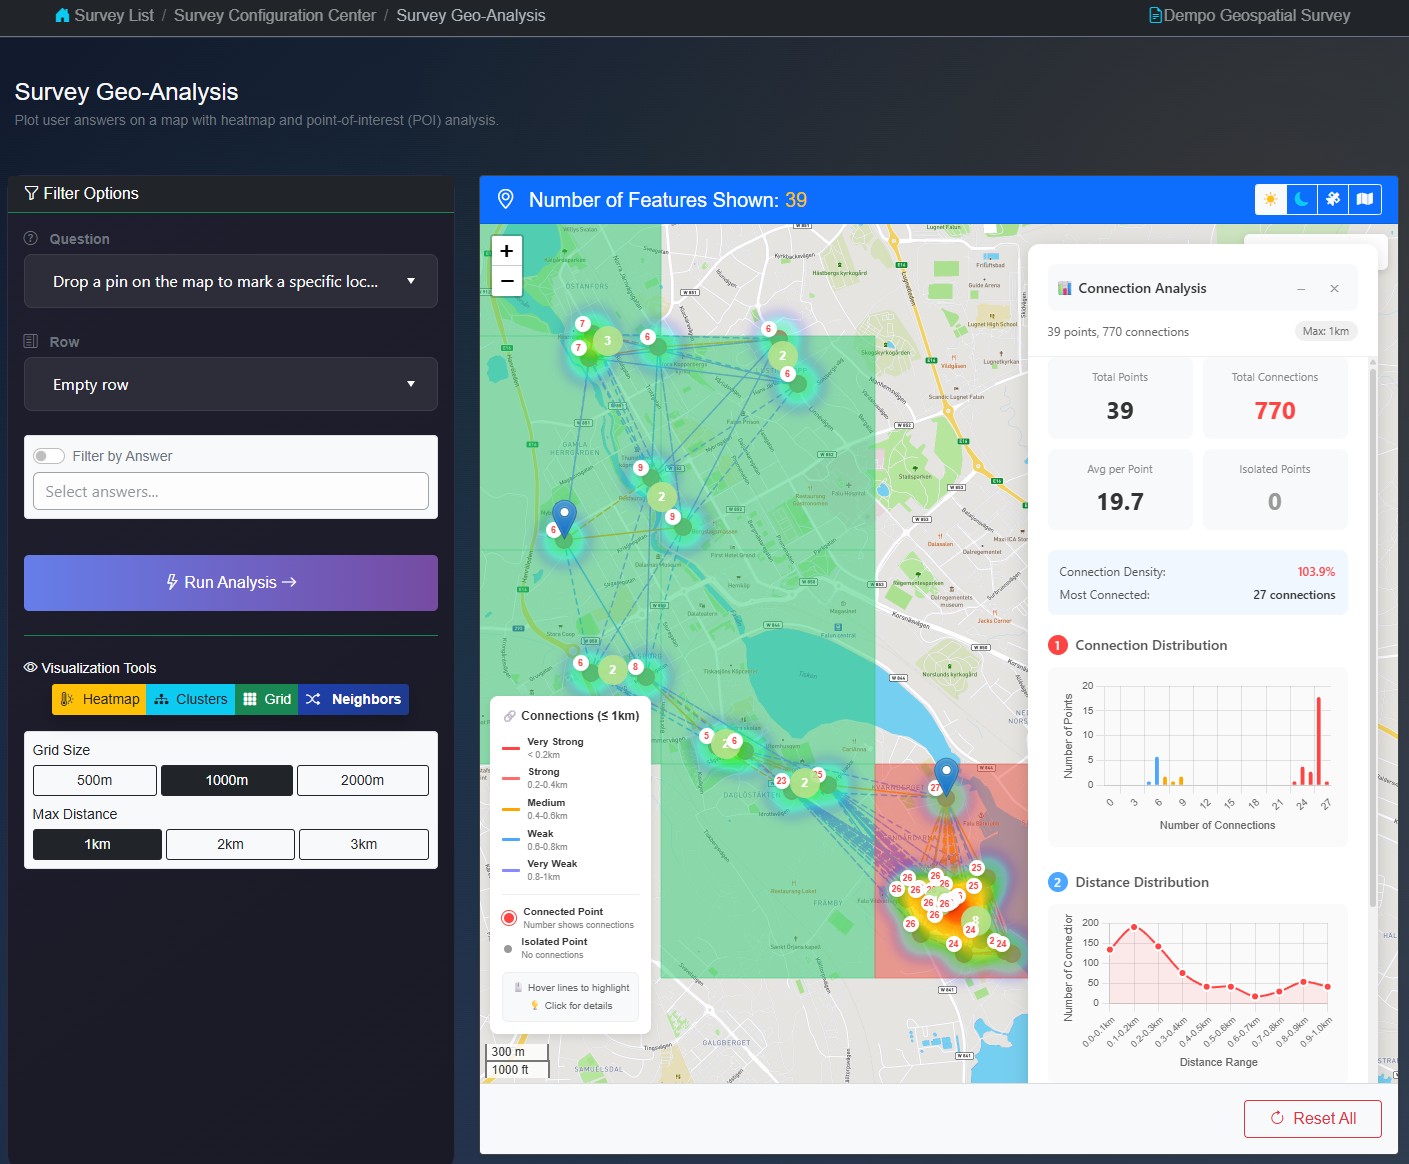
Geo-Analysis Dashboard
Our geo-analysis suite transforms raw location data into clear, actionable insights through four complementary tools. Use Heat Maps to instantly visualize hotspots and patterns with intuitive color gradients. Switch to Grid Analysis when you need exact point counts per area for precise, data-driven decisions. For large datasets, Clustering keeps your map clean and organized by grouping nearby points into expandable clusters. And with Nearest Neighbor analysis, discover spatial relationships by seeing connections between points at your chosen search distance. Together, these tools give you a complete picture of your geographic data from broad patterns to precise measurements, all in one place.
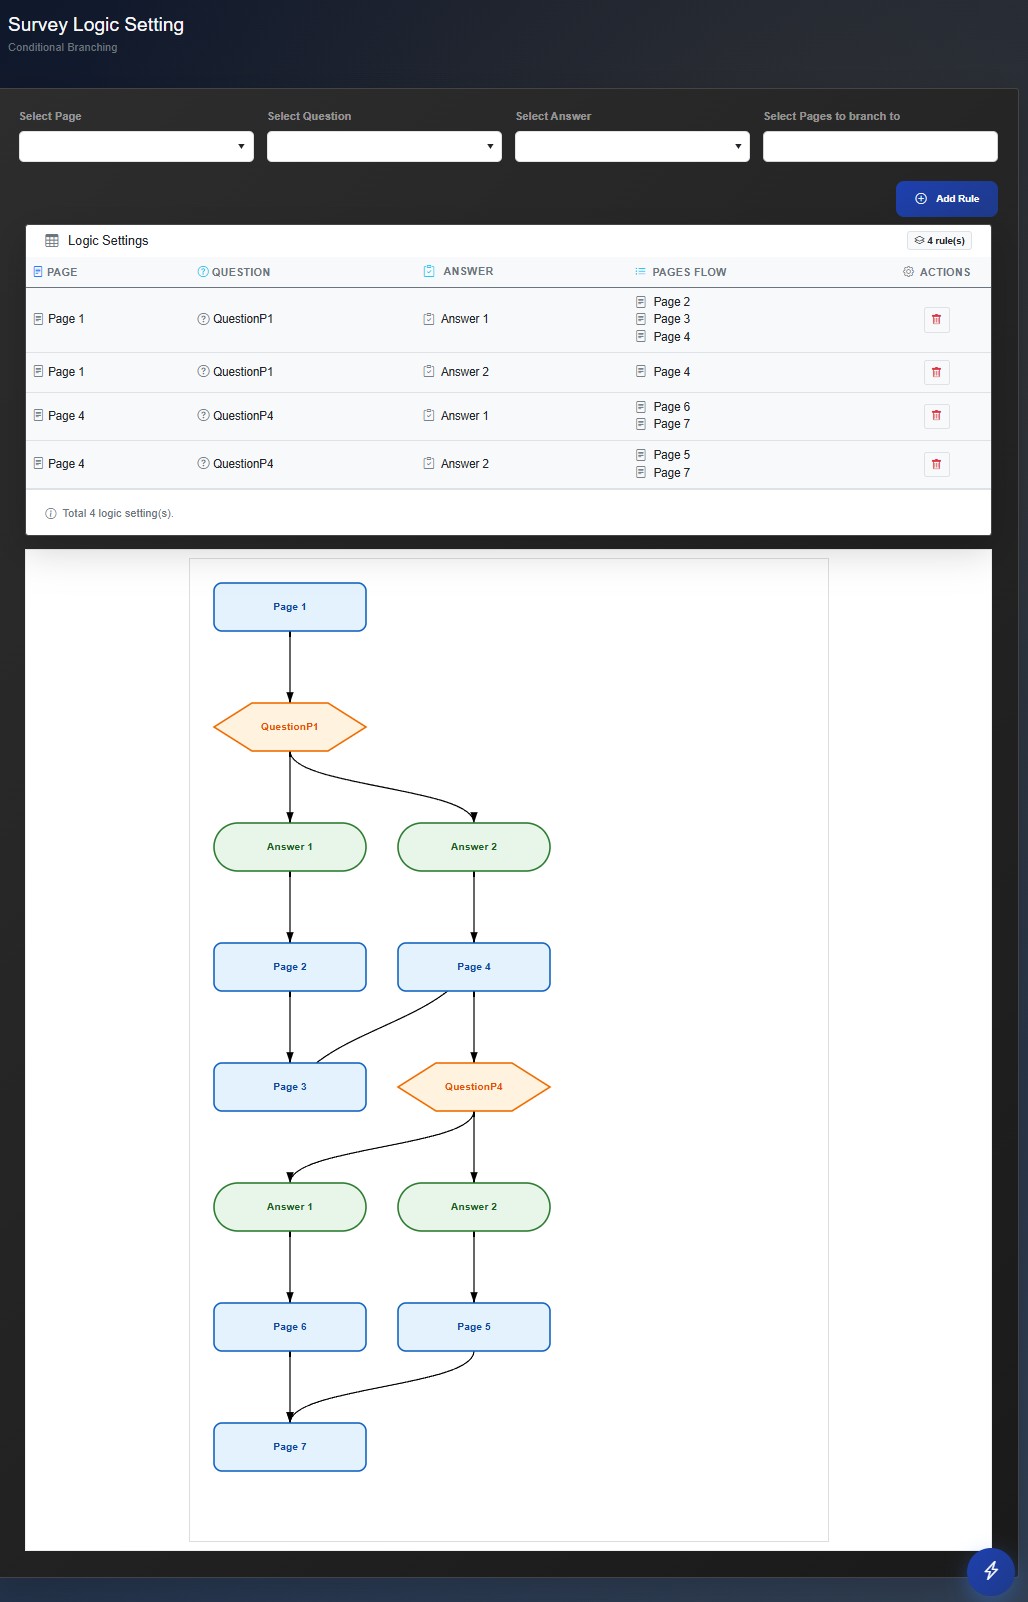
Survey Logic Engine
The Logic Engine allows you to create dynamic surveys by controlling which pages a respondent sees based on their answers. Logic is applied at the page level and uses the answers to mandatory questions to determine the flow.
Key Concept:
You build your logic rules by referencing mandatory questions on a page. The respondent’s answer to these questions then dictates the sequence of subsequent pages.